In this study, we use ten high-resolution z\(\sim\) 6 quasar spectra from the
extended XQR-30 sample to measure the density field in the quasar proximity zones.
It is the first time that the continuous density field is measured at such high redshifts.
We find a higher density environments within the first 1.5 physical Mpc (pMpc) from the quasars, and quantified the host halo mass of these first quasars.
Introduction: Quasar Proximity Zones
Measuring the density of the intergalactic medium using quasar sightlines in the epoch of reionization is challenging due to the saturation of Lyman-α absorption.
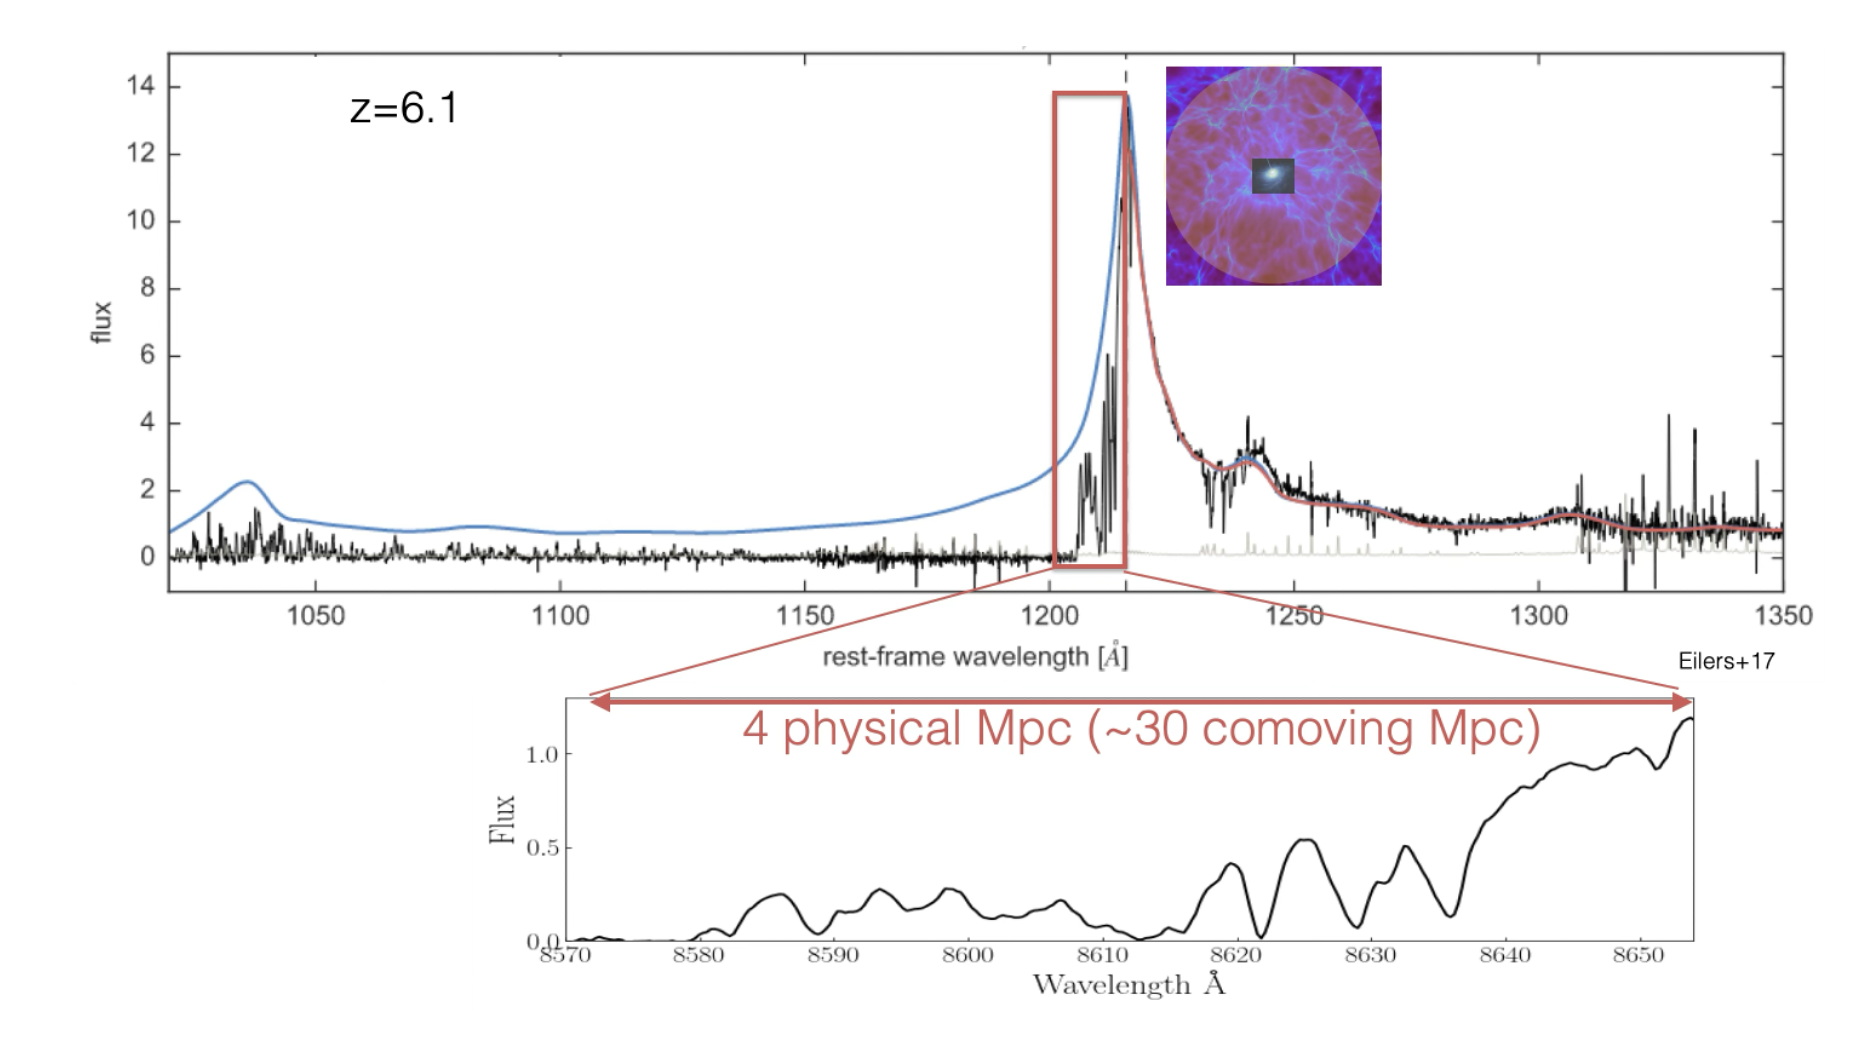
Near a luminous quasar, however, the enhanced radiation creates a proximity zone observable in the quasar spectra where the Lyman-α absorption is not saturated.
An example of \(z~6\) quasar. The red rectangle highlights the proximity zone, where Ly\(\alpha\) absorption is not saturated.
In Chen+21,
we found that up to ~ 4 pMpc away from the quasar,
the intergalactic medium is in photoionization equilibrium.
The photoionization rate \( \Gamma \) is dominated by the quasar and follows an almost ideal inverse-square law profile,
\(\Gamma\propto d^{-2}\).
This relationship allows us to recover the density field using the photoionization equilibrium equation.
XQR-30 Data
To measure the density field at redshift ~6, we utilized the XQR-30 survey,
the largest spectroscopic program targeting quasars from the epoch of reionization.
XQR-30 allocated 250 hours of observations with the X-shooter spectrograph on the ESO Very Large Telescope (VLT)
to assemble an unparalleled, homogeneous sample.
The dataset consists of high-resolution (R ~ 10,000), high signal-to-noise ratio (SNR > 10 per 10 km/s pixel)
spectra of 30 luminous quasars (M1450 < –26.5) spanning z = 5.8 - 6.6.
We select quasars from the XQR-30 survey according to the following criteria:
Redshift Accuracy: Determined using [C II] or CO emission lines
No Broad Absorption Lines (BALs)
No Proximate Damped Lyman-Alpha (PDLA) Systems
Above is a rest-frame spectrum for one of the ten quasars in this study. The black line is the observed flux, with resolution of 22 km/s.
The vertical red line shows the position of the wavelength of Lyman-α. The solid blue line shows the best continuum fitting with dotted blue showing the uncertainty.
Density Recovery Results
Below, we present the density recovery result for one of the quasars. The orange line represents the observed flux, while the thin blue lines show 100 realizations of the continuum fitting. The thin black lines correspond to the recovered density fields associated with each continuum fit.
Cumulative distribution functions (CDFs) of the density within 1.5–3.0 pMpc for each quasar in the sample. The shaded bands indicate the 68% uncertainty, primarily due to continuum fitting.
We find a diverse range of environments within 3 pMpc of the quasars. Specifically, the region between 1.5 and 3.0 pMpc is consistent with the cosmic mean density,
while the inner 1.5 pMpc shows significant overdensities.
Constraints On Quasar Halo Mass
Comparing the observed density fields with simulations allows us to quantify the properties of the quasar host halos.
By comparing the cumulative distribution function (CDF) of density within the innermost 1.5 physical Mpc to that from the CROC simulation,
we found that the observed regions are more massive than those in the simulation box.
We calculated the halo bias parameter and constrained the average quasar halo mass to be \( \log_{\rm 10} (M_h/M_\odot)=12.5^{+0.4}_{-0.7} \).
Reference
Chen, H. et al. 2022, ApJ, 931, 29,
link
Chen, H. & Gnedin, N. Y. 2021, ApJ, 916, 118,
link
Gnedin, N. Y. 2014, ApJ, 793, 29,
link
Gnedin, N. Y. et al. 2017, ApJ, 841, 26,
link
D'Odorico, V. et al. 2023, MNRAS, 523, 1399,
link